Thermal-infrared aerial imagery maps intensity of Thomas Fire as it happened
Analysis could help decision makers allocate firefighting resources, protect public safety during active wildfires, and prepare for future fires.
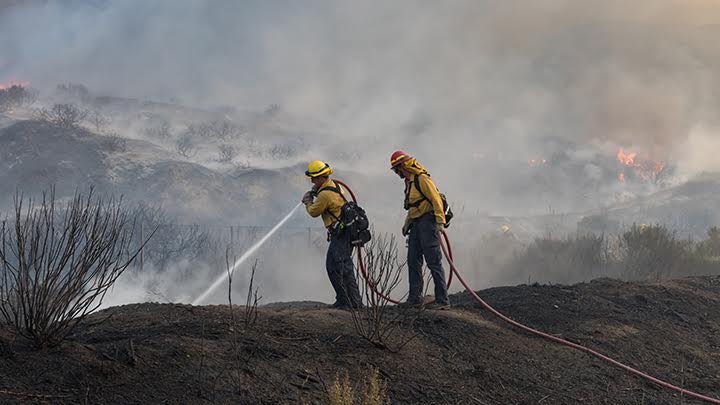
2017’s devastating Thomas fire in Ventura County engulfed more than 380,000 acres, a state record at the time. Now, an analysis of thermal-infrared aerial imagery of the fire could help enable fire response personnel to track the progression of future wildfires in real time, saving resources — and lives.
San Diego State University geographers teamed up with researchers from the U.S. Forest Service to map the intensity of the Thomas Fire across the landscape using aerial images taken every five minutes on December 8-9, 2017. They then reconstructed the path of the fire. The study was published in the journal Fire.
“What we did was to say: ‘how does the energy output of the fire change over time?’” said Alexander McFadden (‘23), now at the California Department of Forestry and Fire Protection (CAL FIRE). He conducted the research while earning his master’s degree in Geography at SDSU, specializing in Geographic Information Science.
McFadden worked with remote sensing experts Philip Riggan and Robert Tissell of the U.S. Forest Service Pacific Southwest Research Station to obtain aerial image sequences that had been taken during the fire. The images were captured using a specialized sensor that measured thermal-infrared radiation on the ground. The sensor was installed aboard a twin-propeller aircraft that flew reconnaissance above the fire. The images provided an estimate of surface temperature and fire radiative energy density — also known as FRED. This information was used to determine fire intensity at each time interval.
“We can measure how quickly the fire is progressing by taking one image and drawing where the perimeter is,” said McFadden. “You take the second image five minutes later, you draw another perimeter, and you can kind of connect the two. Then we say ‘okay, how much fuel was in the area that the fire progressed through? Was it traveling up? Was it traveling down? What was the wind speed and direction? And what was the fuel type?’”
To date, most analyses of fire intensity progression have involved controlled, experimental burns covering smaller areas. While these studies can be useful, according to McFadden, they provide limited information about landscape-scale wildfires.
“You're typically burning through grass, maybe a couple of shrubs and maybe some trees,” said McFadden. “But it doesn't necessarily reflect what we're seeing on the ground. You can have a surface fire just burning on the ground, or you can have a crown-replacing fire, which consumes all the vegetation. It burns up the trees, it burns up the shrubs and everything is dead. These two fire types are going to have different types of fire behavior.”
To understand the behavior of a crown fire, he adapted algorithms that had been previously developed for Forest Service controlled burn experiments, and applied them to actively progressing crown fires over large landscapes.
“You create what's called a time series, how much energy is being released over time, and get the total amount of energy that's released.”
Professors emeritus of geography Doug Stow and John O’Leary and mathematician Henry Scharf — now at the University of Arizona — advised McFadden on the analysis.
To get a more accurate estimate of fire intensity, the researchers also controlled for the effects of smoke produced by the fire to better quantify what was actually happening on the surface. “Smoke can absorb that radiation and give you a reading that's a lot lower,” he said.
Tracking wildfires
During active wildfires, authorities are constantly making decisions about how to allocate limited resources to emergency response efforts. McFadden said the tools developed by the study are publicly available and could facilitate this process by revealing the behavior of wildfires in real time, including how fast they are spreading and in which direction.
He said satellite imagery can also be used for this purpose, but they can lack the resolution of thermal-infrared images taken from aircraft.
“If we ultimately want to combat these wildfires to the best of our ability, and if we want to save lives, if we want to save homes, if we want to save our neighbor, it is, I think, our duty to integrate the best technology that we currently have to do that.”
The study could aid state agencies, fire departments and decision makers in choosing where to concentrate fire suppression and postfire recovery efforts and when to evacuate during active wildfires to protect public safety and minimize losses.
The tools could also be useful for preparing for future wildfires.
“There's a lot of things that can kind of happen post-fire that can dictate the fire regime within the area for the next 10 to 30 years,” said McFadden. “That's why this imagery is so important because it can help understand what these fires are doing and how we can prepare for them in the future.”